

LISTEN TO EVOLVE
At the Aernnova Group, we value people’s well-being not only as a value, but also as a strategy. That is why we decided to conduct a work climate survey in some of the Group’s companies with the aim of finding out how our teams feel, what they value, and what aspects need improvement.
To do this, we hired the specialist consulting firm ieTeam Consultores, which guided us through a structured and transparent process.
The process was carried out in three stages:
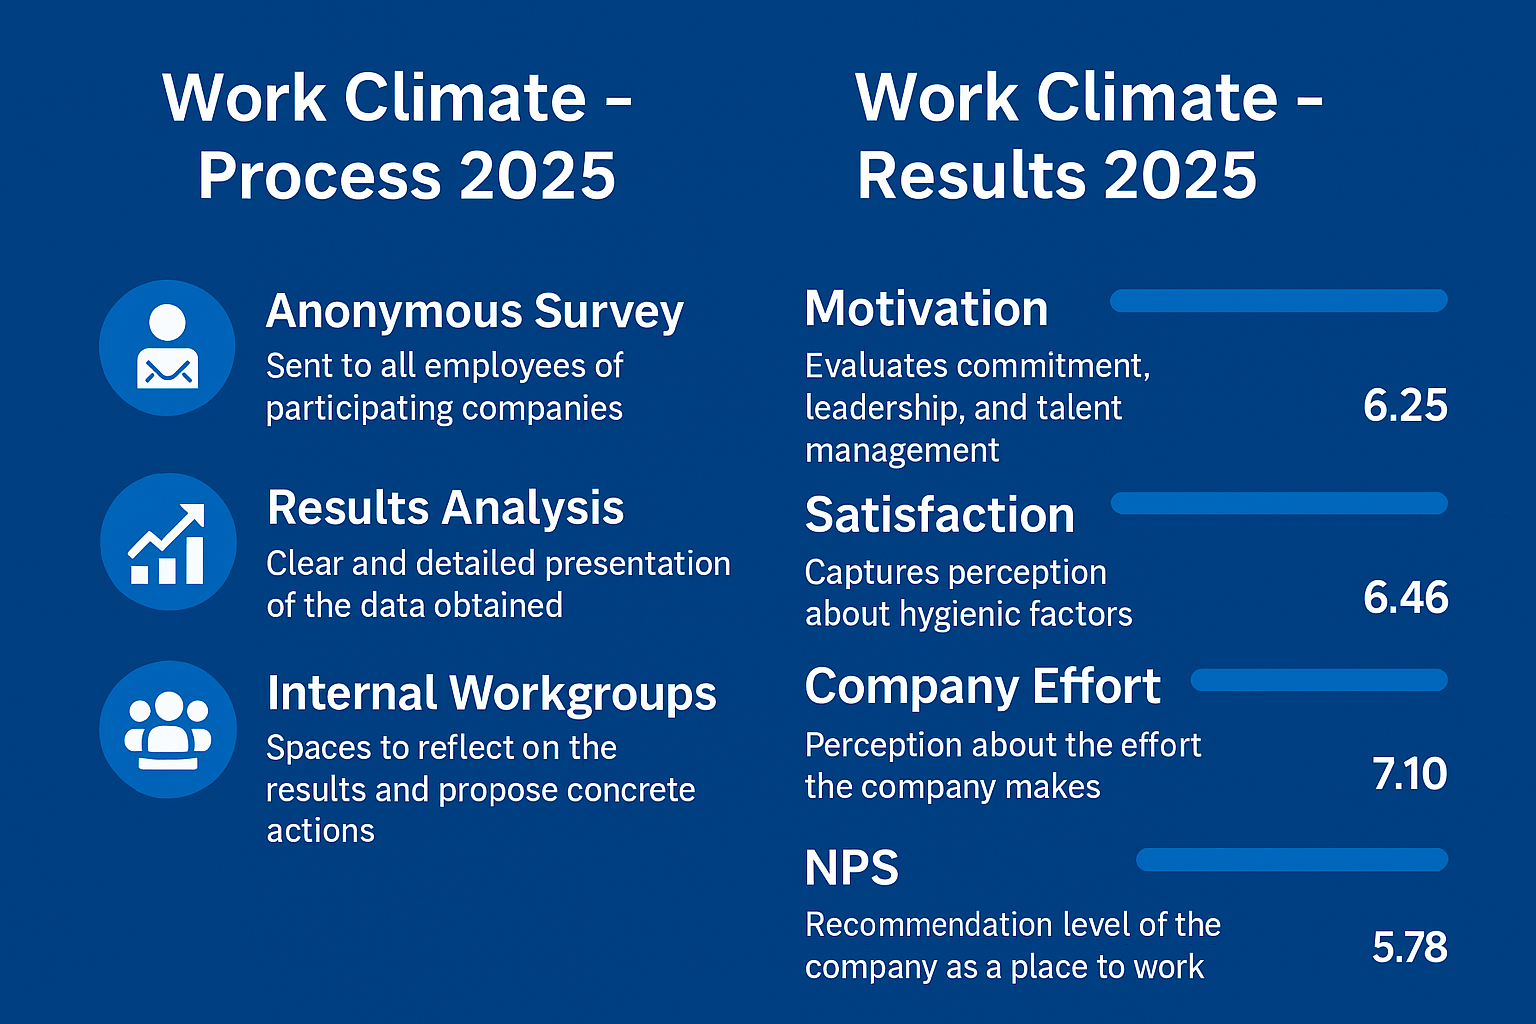
-An anonymous survey sent to all employees of the participating companies.
–Analysis of results, with a clear and detailed presentation of the data obtained.
-Creation of internal working groups to reflect on the results and propose concrete actions.
This approach allowed us not only to measure the work environment, but also to initiate an internal conversation that encourages active listening and collaborative improvement.
RESULTS: AN HONEST LOOK AT OUR ENVIRONMENT
With regard to Aernnova Corporation and Aernnova Aerospace, with a total of 240 people surveyed, the results of the survey provided us with an accurate snapshot of what day-to-day life is like in our organization. Below, we share some of the most relevant data collected at Aernnova Aerospace Corporation and Aernnova Aerospace.
Motivation: 6.25
This indicator assesses aspects such as commitment, leadership, and talent management. It reflects how people feel about their purpose within the company, the inspiration they receive from their leaders, and the development opportunities they perceive.
Satisfaction: 6.46
This value reflects perceptions of hygiene factors, internal dynamics, and working conditions. In other words, how people experience the physical environment, work organization, and relationships between teams.
Both results place us in an area for improvement, although there is room to strengthen both the motivation and satisfaction of our teams. Therefore, these results invite us to take action, listen more, and work together to build a more stimulating and healthy work environment.
Along with the above factors, others have also been analyzed, such as:
Company Effort: 7.10
A factor that marks employees’ perception of the company’s efforts to improve their experience.
NPS: 5.78
This indicates the level of recommendation that employees make of our company as a place to work.
All these results were obtained from an emotional scale in which respondents rated how they feel about the company. The options included emotions such as “happiness,” “commitment,” “motivation,” “satisfaction,” “indifference,” “disappointment,” “frustration,” “boredom,” “stress,” and “anger.”
The indices obtained point, in general, to a positive perception of the company, while also highlighting that there is room for improvement in terms of the emotional bond between people and the organization.
WORKING GROUPS: FROM DATA TO ACTION
To ensure continuity in the process, both parent companies have created a multidisciplinary working group made up of employees from different areas. Its mission is clear:
–Analyze the results in depth.
–Actively listen to the experiences and suggestions of your colleagues.
–Draw conclusions that reflect the team’s real needs.
–Design specific actions to improve the work environment.
This group is already up and running, and will soon begin generating proposals that will be shared with the entire organization. This process reinforces our culture of collaboration and empowerment.
LOOKING TO THE FUTURE: COMPETING FROM A POSITION OF WELL-BEING
This exercise not only helps us improve internally, but also positions us ahead of other companies in the sector. There is no doubt that a healthy and motivating work environment is a differentiating factor in attracting and retaining talent.
That is why our goal for the next survey is to confirm positive progress in all indicators, the result of joint efforts and a firm commitment to people’s well-being.